
"Gen AI-fication" of Analytics
Insights from the Road..And The Best Leadership Advice I Heard This Week

If you’ve been following my LinkedIN feed, you know that I’ve been on the road with customers, partners and analysts and participated in the Worldwide AI Action Summits across Europe.

We’re learning a lot about how customers are succeeding with Generative AI, at scale AND in production. One pattern that caught my attention is how rapidly Gen AI is changing the way we can now answer business questions in the enterprise.
We’re witnessing the "Gen AI-fication" of Analytics. A customer shared a stats with me this week that brings this home: “Our users have built 20,000 dashboards in the last few years. 18,000 of them are used by less than 8 users”
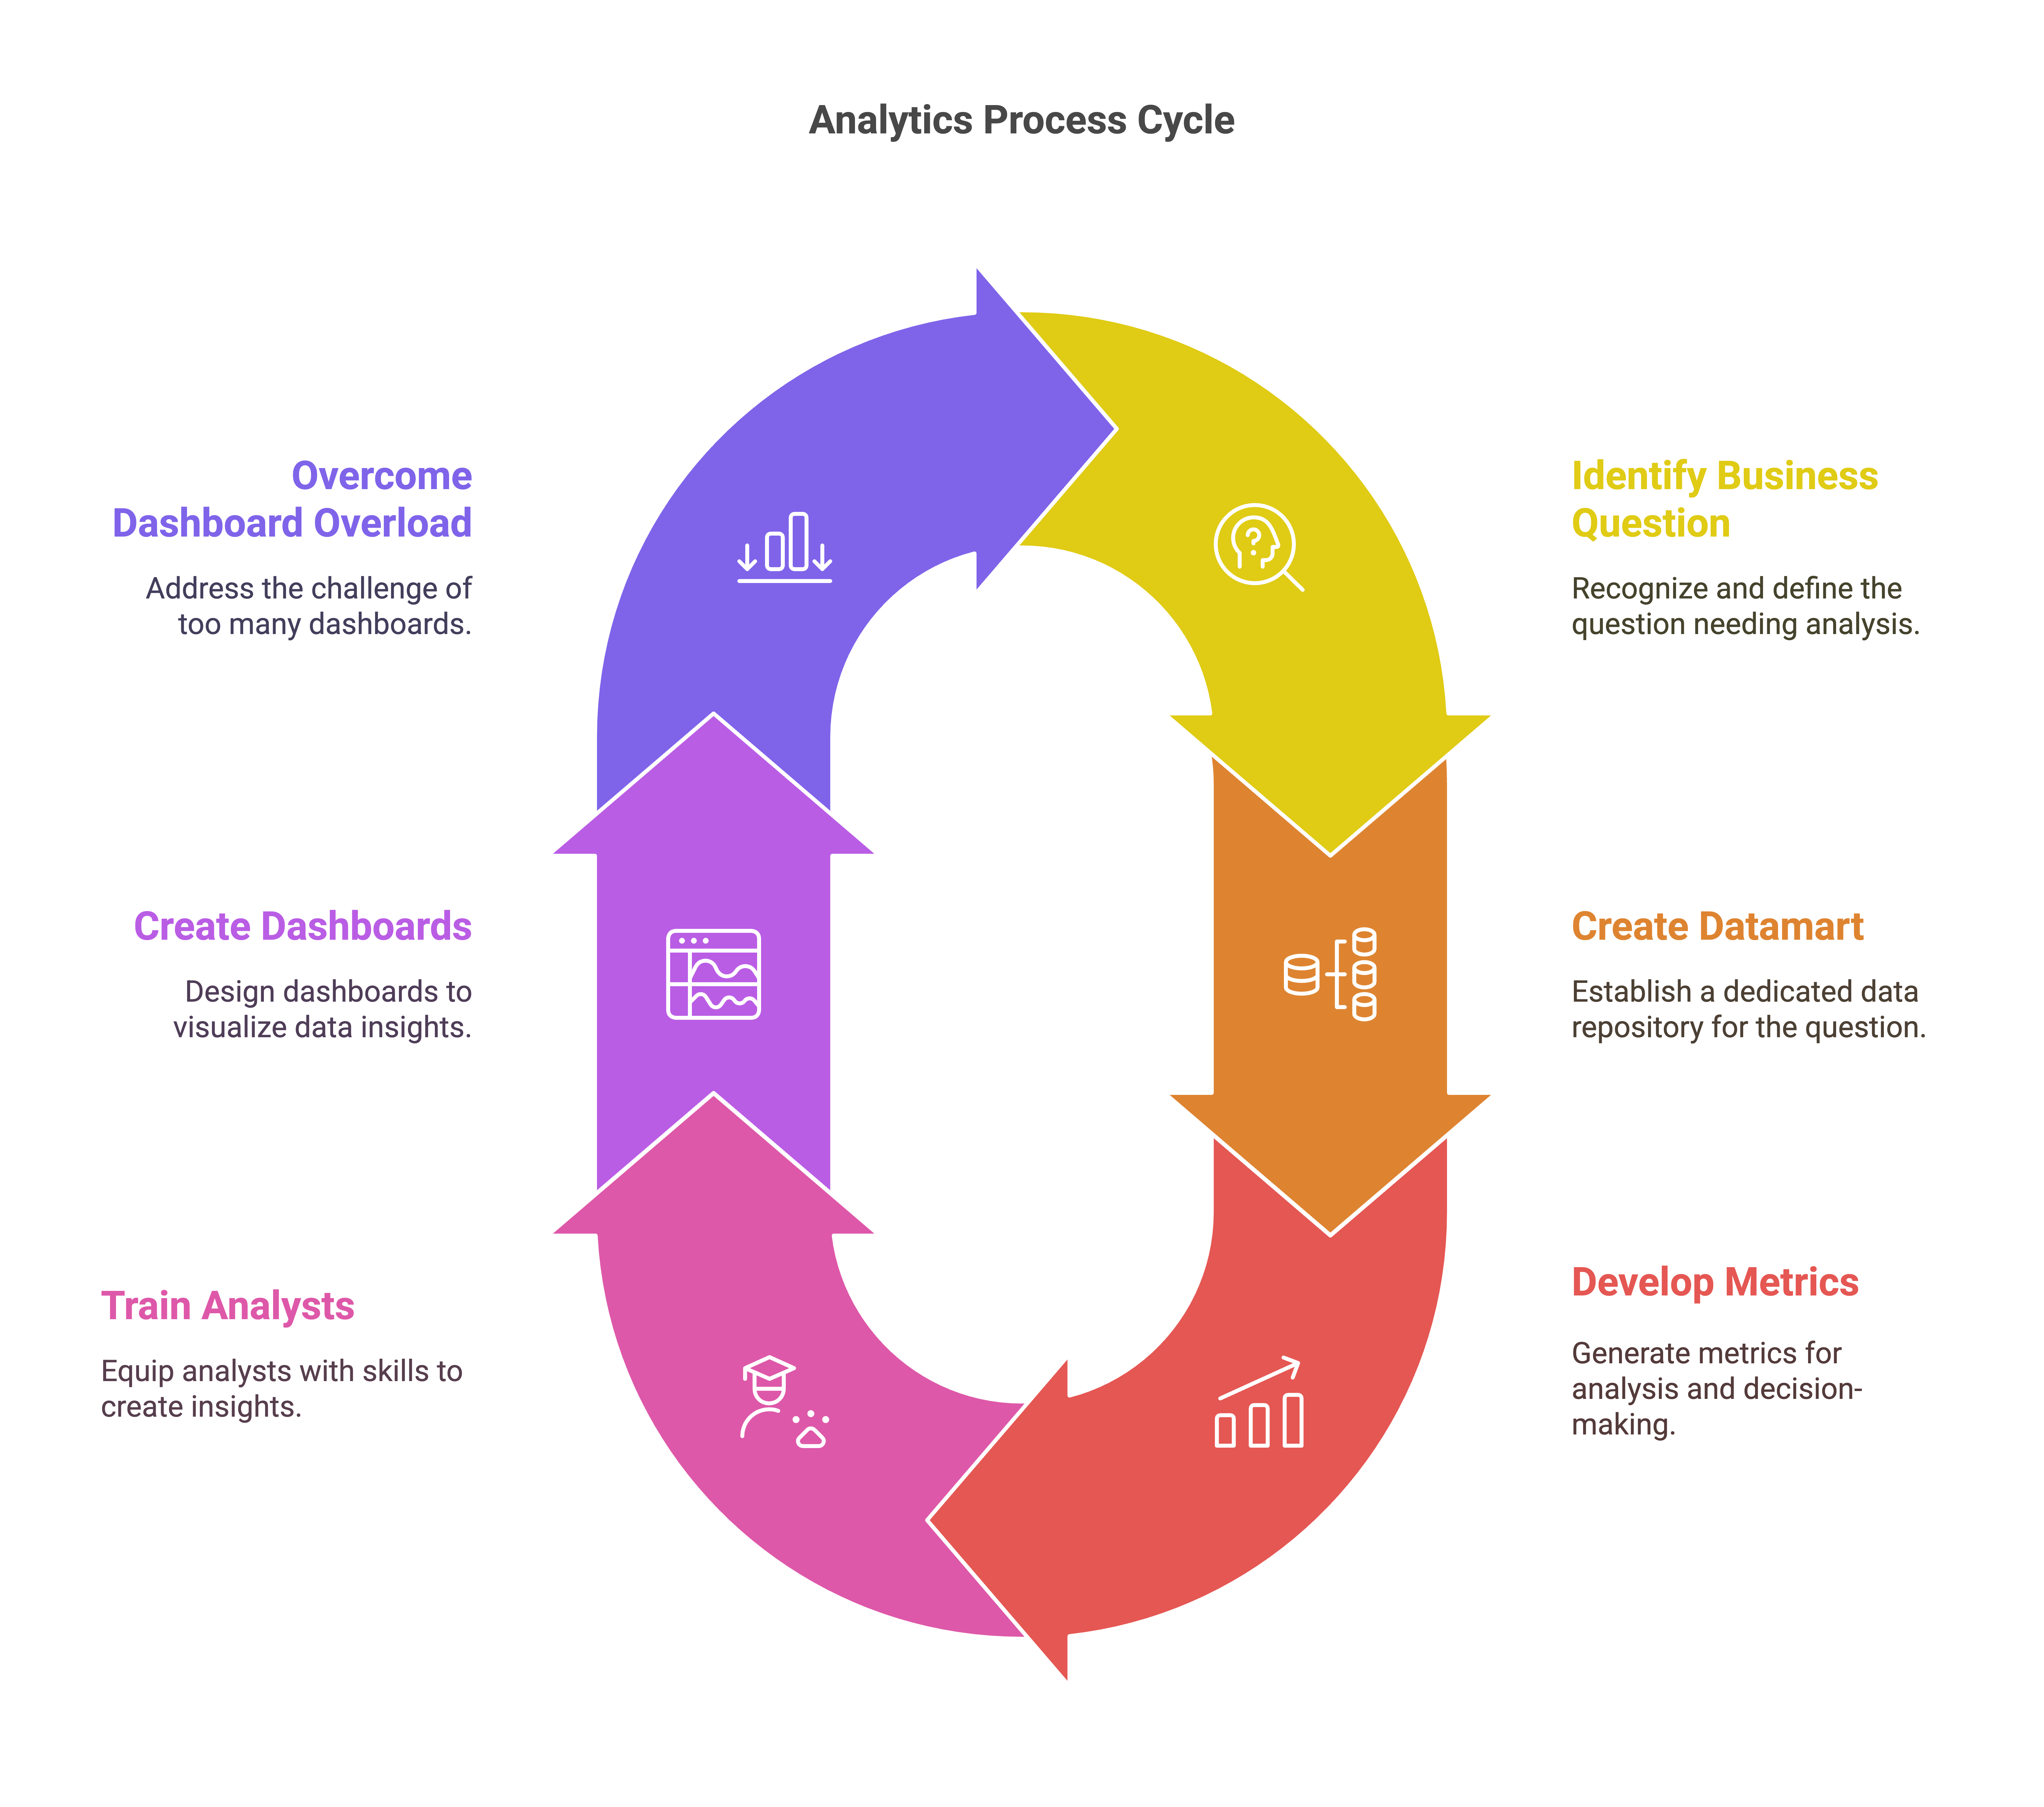
How did this happen? Let’s review the typical “Analytics Supply Chain”
Analytics’ “Job To Be Done” is about answering business questions (so far, so good).
There has historically been 2 primary ways to handle this job: 1) self-service and 2) standardized reporting.
Standardized reporting has been…well…”standardized”. Self-service however seems to have gone out of hand for some: after 30 years of existence, it seems only 30% of dashboards are adopted. 84% of users report a poor experience. And while it takes too long to serve a dashboard at scale, 86% of its data is judged unreliable.
In short, we’ve managed to engineer a “less-than-optimal” supply chain to answer business questions ad-hoc. Let me try to describe the enterprise analytics reality, without jargon:
Got a question? No problem.
If we don’t already have one, let’s create a dedicated datamart for this domain (we’ll pipeline data from multiple places, transform it as needed…etc)
Let’s then create metrics that can be consumed downstream, closer to the question. 👍🏻
Let’s hire & train data scientists/analysts to build dashboards, views…etc.
Let’s make sure they understand decision making isn’t ALWAYS about logic. There is science AND art. Dashboards must be visually appealing.
Some end up creating great dashboards. Some turn into “infographics” that are low on info, high on graphics. 🤨
Worse than infographics, are ephemeral dashboards that answer a set of questions in the moment, for a few people only, but yet need to be maintained.
Let’s train business users then? There is simply no way we can hire enough analysts and scientists to handle all incoming questions. The problem isn’t just the ephemeral questions. We also noticed that, for every question, another 6 more need to be answered.
Let’s have analysts, scientists and business users create more dashboards. More Dashboards are created.
Final Stop: Dashboards, Dashboards Everywhere But Not A Drop of Insight…(I wrote about this here a bit ago)
Wait…What Was The Question Again?!
Is the end of the dashboard near? Not quite. But, with Gen AI, we might have the opportunity to simplify this supply chain. It seems that the answer became so complex, we forgot the question.
With “Gen BI” is done right, we might have the opportunity to help our industry get closer to the job: timely answers with high accuracy (and responsibility).
Easy to say. Difficult to do. I know. But, if there was a moment in history to make this happen, it could be now.
Thoughts?! Does this sound right? How many of your dashboards were created to answer questions a well orchestrated Analytics Agent should asnwer?
The Best Leadership Advice
The User Guide I shared a few months ago seemed to have helped many of you (thanks for all the feedback!). For those who haven’t checked it out yet, see more here.
Here is a video that summarizes one of the key qualities I highlight in the guide. Hope you’ll enjoy it as much as I did!
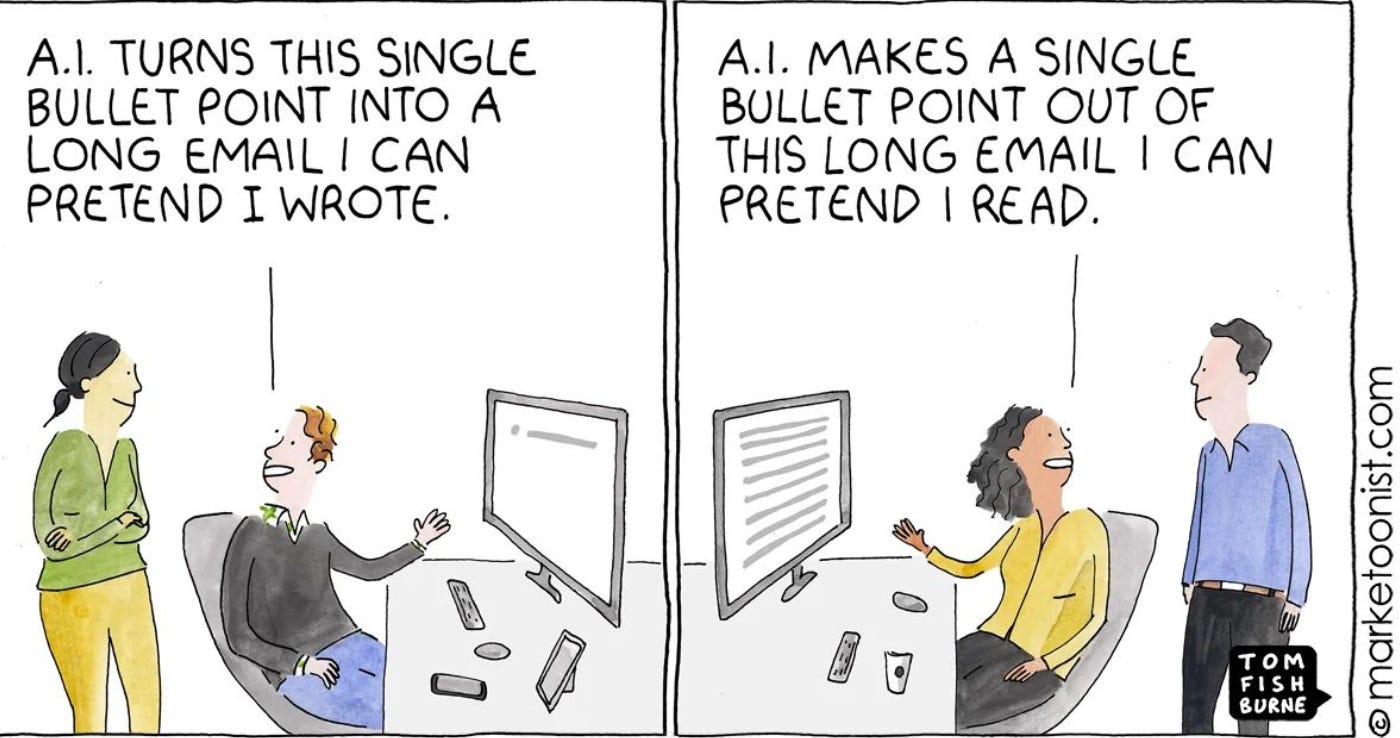
A.I. for A.I
No Comment.
Thanks
for the share.